top of page

CALIFORNIA OWNER-OCCUPIED HOUSING DATA BY COUNTY, 3 WAYS
CLIENT
UC Berkeley Cartographic Design Course
YEAR
2021
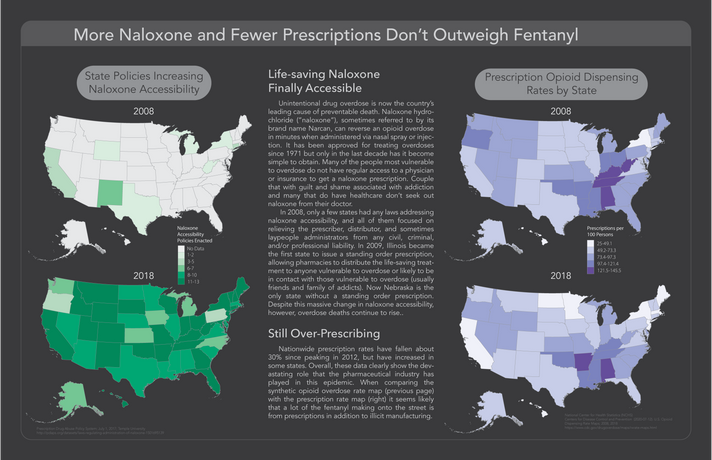
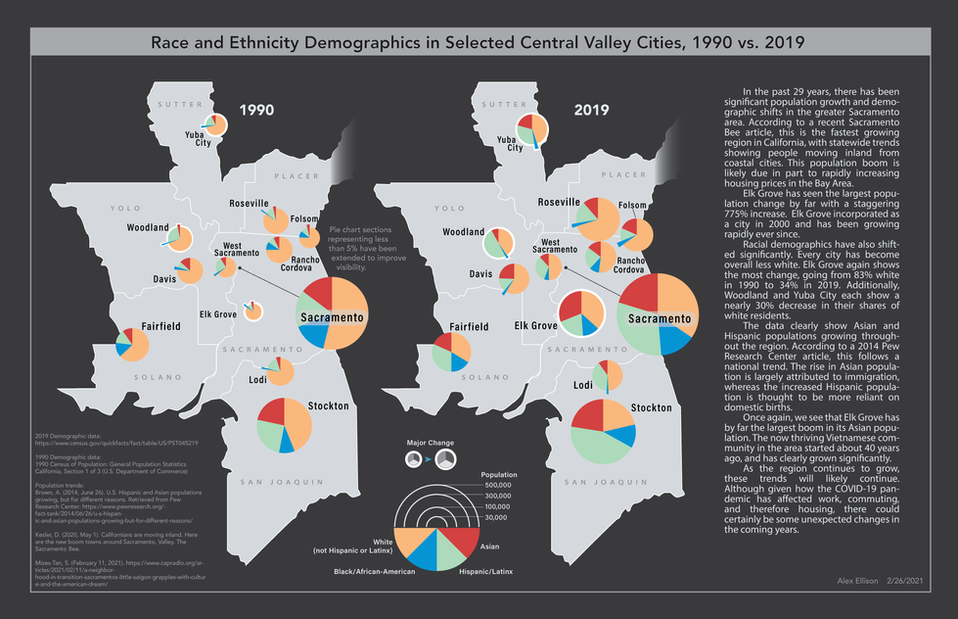
I produced these maps for a cartographic design course I took in 2021. The course focused on maps as data visualization, and this project exemplifies the importance of understanding the data when designing graphics. In this map, the same data set is represented using 3 different data classifications, natural breaks, equal interval and quintile. The vertical bars show how the data are distributed and where each data classifcation breaks them. Below I've included a few other maps I designed in the course.

bottom of page

